|
About the Histogram A histogram is a graph that shows the frequency distribution of an image's data values, which makes it convenient for checking an image's brightness or darkness or the trends in the colors it uses.
With this camera, you can use the histogram to check the following.
- Brightness Display: Trends in exposure levels and overall gradations
- RGB Display: Color saturation and gradation
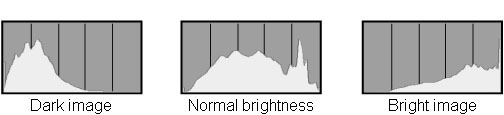
[Brightness] Display This histogram shows the distribution of brightness in an image as a graph of brightness along the horizontal axis (Left: Dark; Right: Bright) and a stack of the number of pixels at each level of brightness along the vertical axis.
Within the screen, the peaks in the graph will skew more to the left the greater the dark components of the image there are, and will skew more to the right of the graph the greater the bright components of the image there are. Components up against the left edge of the horizontal axis are crushed blacks, and components up against the right edge are blown highlights. The components in other areas reproduce gradations.
By looking at an image and its histogram, you can check the exposure level and the overall gradation in the image.
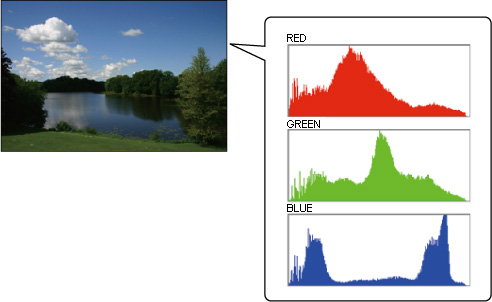
[RGB] Display This histogram shows the distribution of brightness in an image as a graph of brightness along the horizontal axis (Left: Dark; Right: Bright) and a stack of the number of pixels at each level of brightness for each of the R (Red)/G (Green)/B (Blue) colors along the vertical axis.
Within the screen, the peaks in the graph will skew more to the left the greater the darker, thin colors of the image there are, and will skew more to the right of the graph the greater the brighter, dense colors of the image there are. Components up against the left edge of the horizontal axis have little or no color information, and components up against the right edge are saturated, with no gradation. By looking at an RGB histogram, you can check the saturation of color and the gradations in the image.
How to Change the Histogram Display To switch between the [Brightness] and [RGB] displays, follow the procedure below.
1. Turn on the camera.
- Set the camera's power switch to <ON>.
2. Press the <MENU> button to bring up the menu.
3. Press the <  > button and turn the <  > dial to select the [  ] tab.
4. Turn the <  > dial to select [Histogram], then press the <  > button.
5. Turn the < > dial to select [Brightness] or [RGB], then press the < > button.
6. Press the <MENU> button to turn off the LCD monitor.
This completes the process of changing the histogram display.
|